December 28th, 2023
Microsoft just added a new button slicer to Power BI. We like it. Actually TMap can be used as a button-like slicer.
The following example shows that when you click a polygon such as "Ontario" on Canada map, the polygon will be highlighted, and chart and table visuals will show Ontario's visible minority data only. If you click empty space on the map, it will show all Canada's data.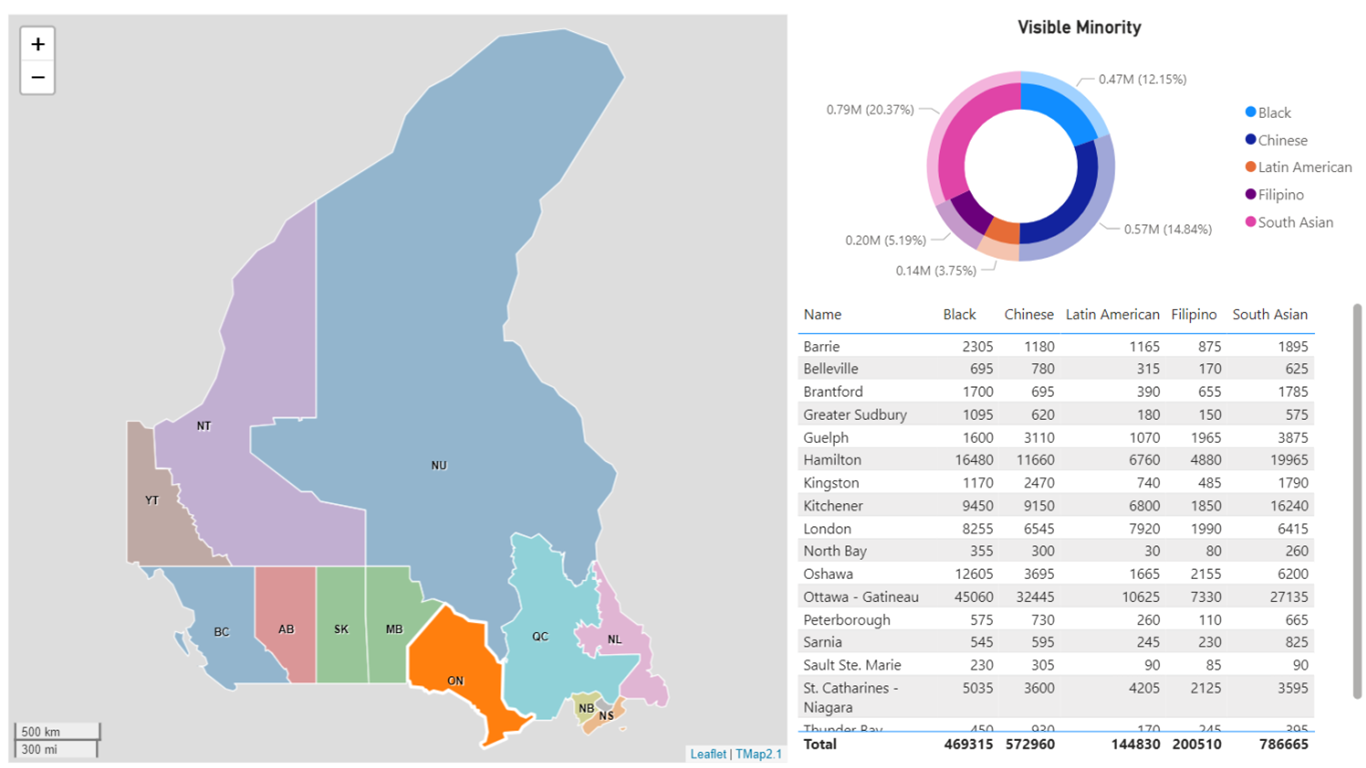
Even if the Map has both polygon layer and symbol layer, we still can select a region on the map and filter out to other visual.
The screenshot below shows that when clicking and selecting a polygon on a donut chart map, the data will filter out to the bar chart visual and card visual. It will help us to explore insights in different dimensions.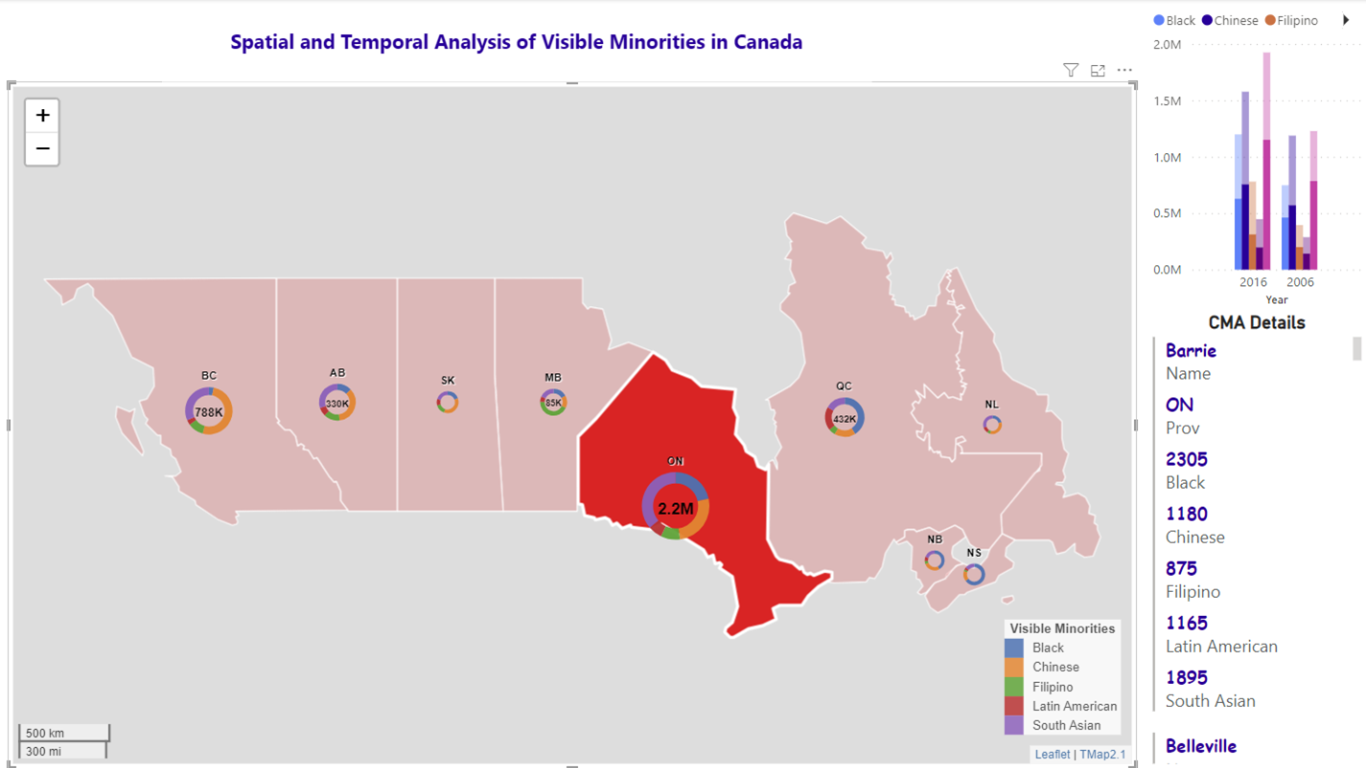
You can go to Microsoft AppSource to download TMap Visual and try it.
To learn more on how to use it, please read tutorials
.